Dashboard Templates
Create Dashboard Templates
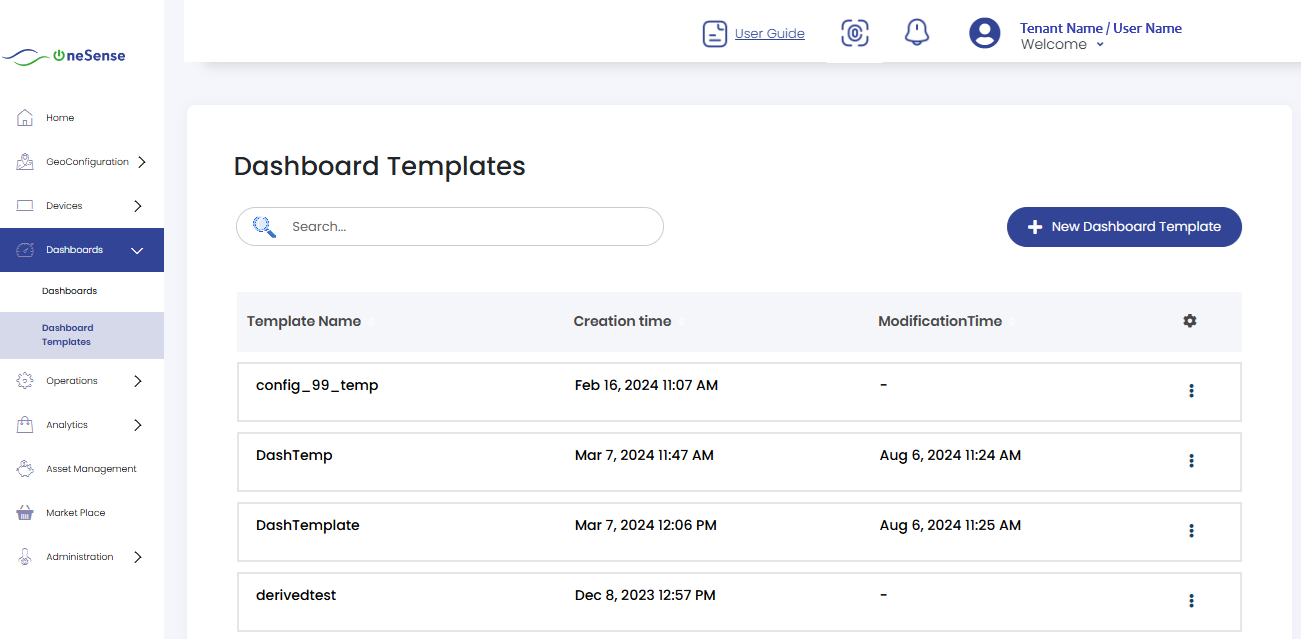
Here, you can view the list of previously saved templates.
 To create a new dashboard template, click on **New Dashboard Template** located at the top right in the dashboard template list page.
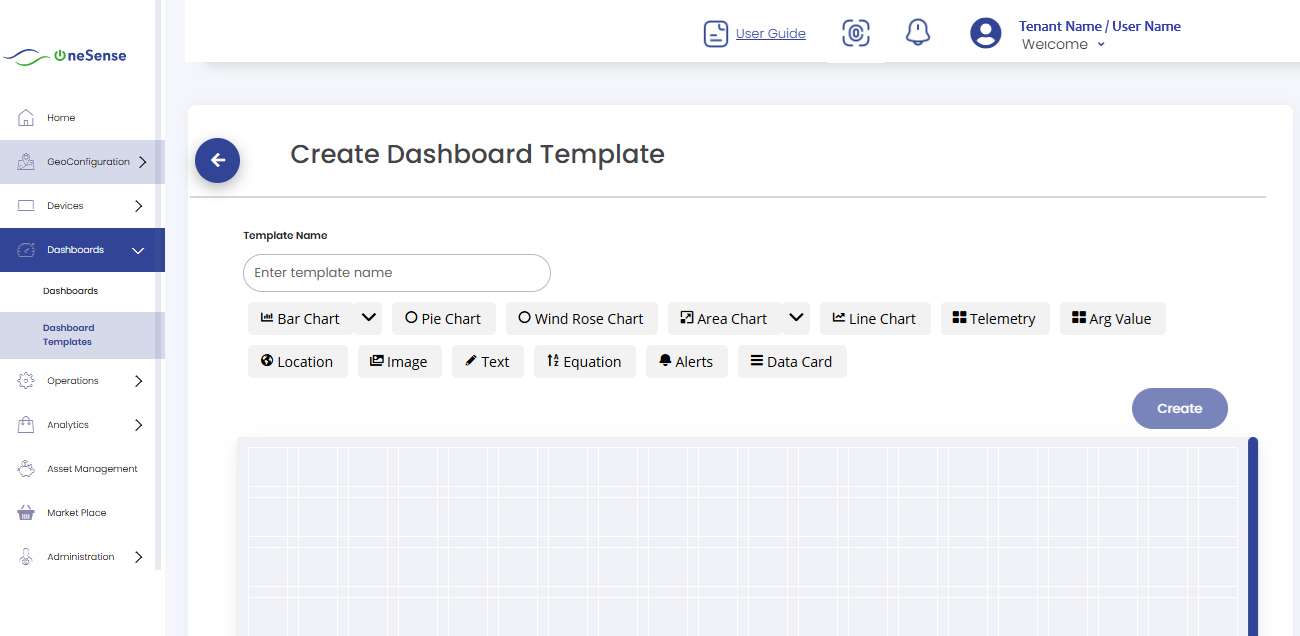
You will be redirected to the **Edit Template** page where you can add, resize, or remove charts and features such as:
- Bar Chart (with option for Stacked Bar Chart)
- Pie Chart
- Wind Rose Chart
- Area Chart (with option for Stacked Area Chart)
- Line Chart
- Telemetry
- Arg Value
- Location
- Image
- Text
- Equation
- Alerts
- Data Card
After adding your desired features and giving a **name** to the template, click on the **Create** button to save the template.
Charts & Features Setup
For Bar Chart, Pie Chart, Wind Rose Chart, Arg Value, Area Chart, and Line Chart:
First, click on the chart type you need.
A popup window asking for details will appear (as shown below).
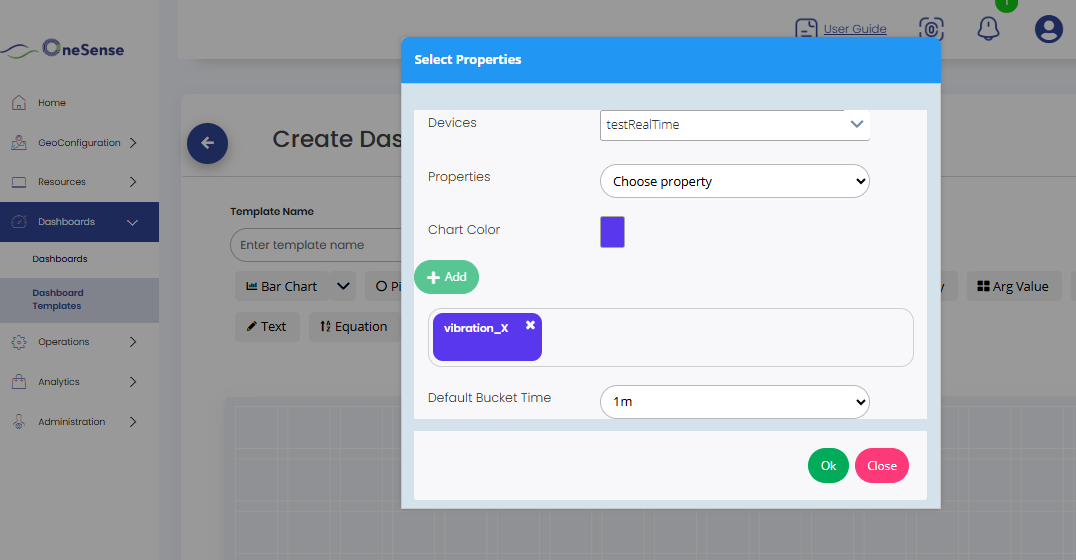
Select the devices needed.
Add properties such as temperature, humidity, etc.
Steps:
- Select a property
- Choose a color
- Click Add
- Repeat for additional properties
Select the bucket time in minutes (e.g., 5m → shows aggregated values in 5-minute buckets).
You can change both the bucket time and the aggregation type (avg, min, max) in dashboard.
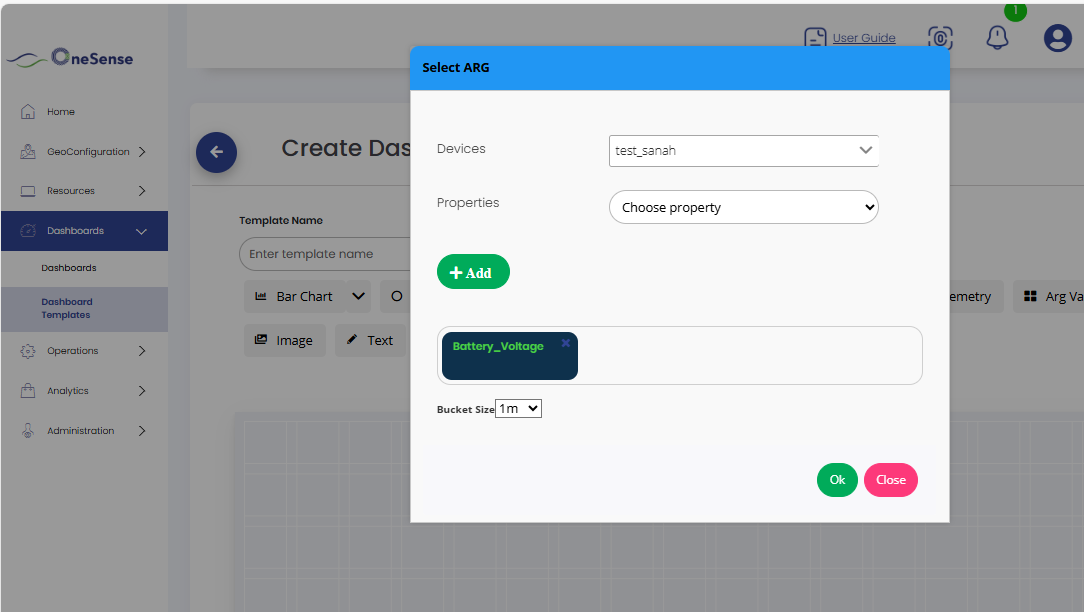
For Arg Value, filling details is shown in the following image:
Other Features
Telemetry, Location, Image, Text, Alerts, Data Card → No custom setup required. Once selected, they directly show data.
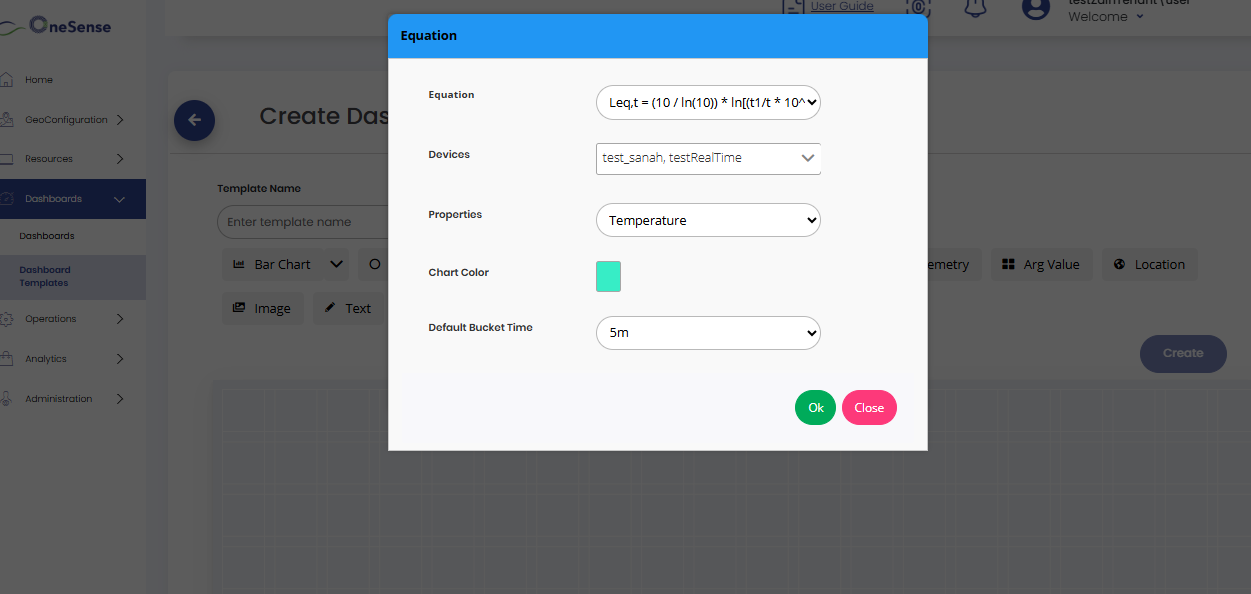
Equation → Requires setup:
- Click on the Equation feature.
- Select the equation you want to apply.
- Choose the property (temperature, humidity, etc.).
- Pick a color.
- Select bucket time.
- Click OK.
This will appear as a derived chart when using a dashboard created from this template.
Creating Dashboards from Templates
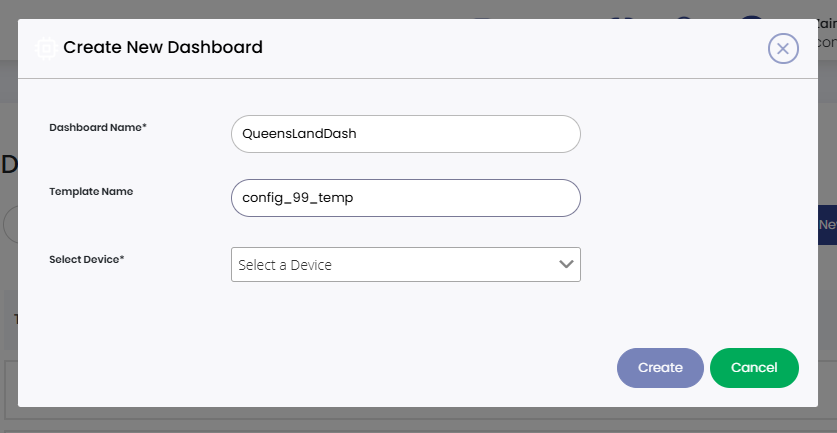
After creating a template, you can also create dashboards directly from the **Dashboard Templates** section (without going to the Dashboard section in the UI).
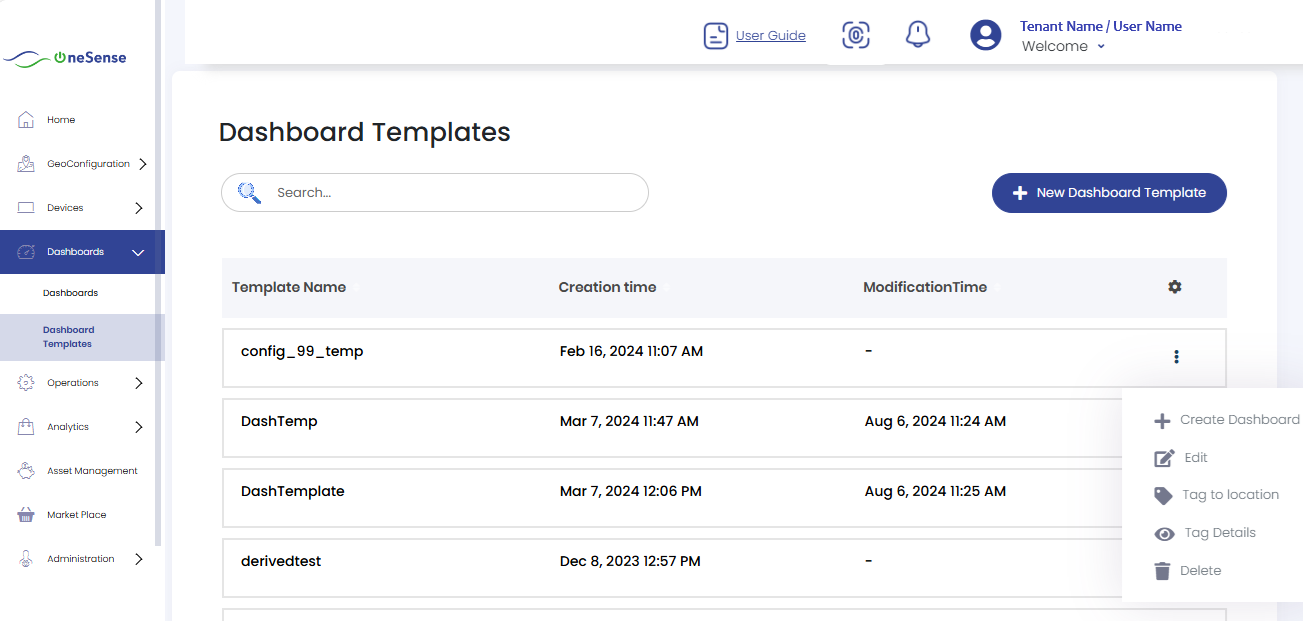
Click on the settings dropdown located on the right side of the respective template and select '+' to create a new dashboard for that corresponding template.
Editing Dashboard Templates
From the settings dropdown, select **Edit** to modify the template.
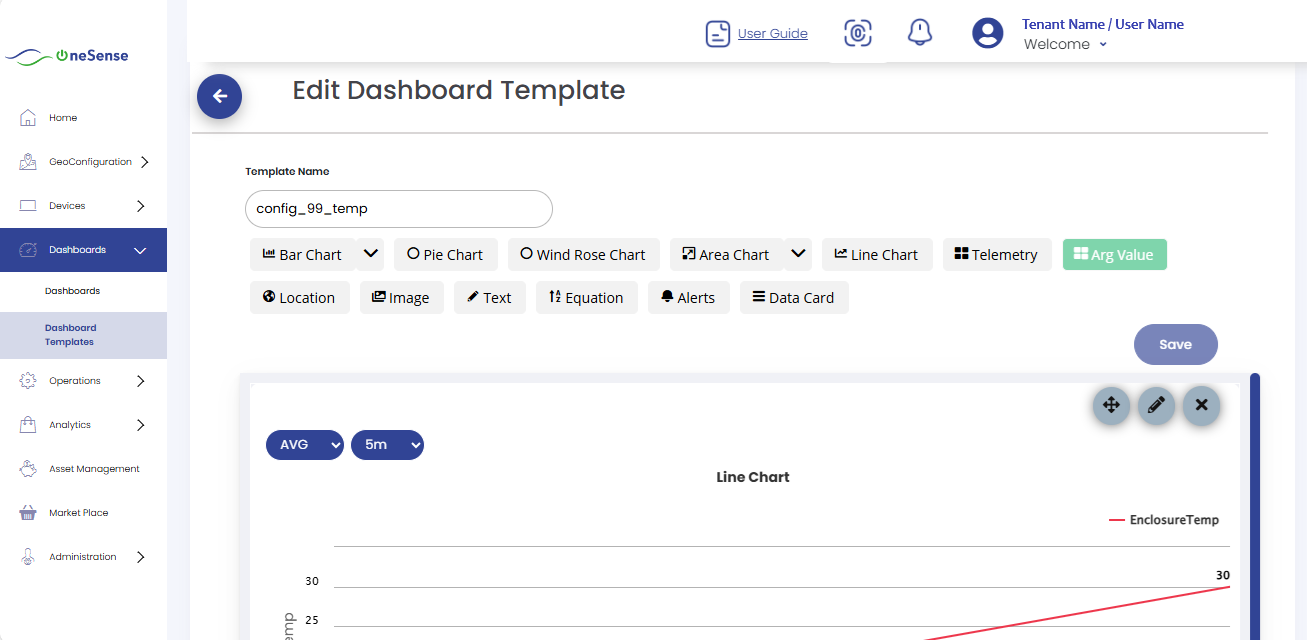
Here you can adjust details such as telemetry, images, text, etc. Remember to click the **Save** button after making changes.
Changes are done same way as creating a template. You can add, remove and resize the Charts and Features listed. Also you can move or edit the Charts/Features itself.
Tagging Templates
Click on "Tag" to assign a tag to the location for that specific dashboard template.
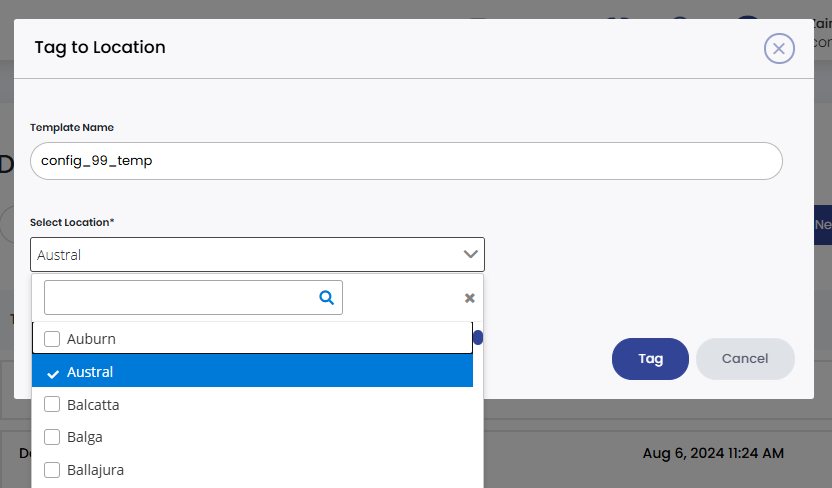
Select the location from the given list of locations.
Click the "Tag" button to assign a tag to that template.
In the Templates list page, click the settings dropdown on the right side of the respective template and select "Tag Details" to view the tagged locations for that template.